Posted by Jonathan Miller - Wednesday, November 14, 2012, 8:44 AM

Last month we created and published a new report on the Manhattan rental market for 10-2012. ?This is part of an evolving market report series I?ve been writing for Douglas Elliman since 1994.
MANHATTAN
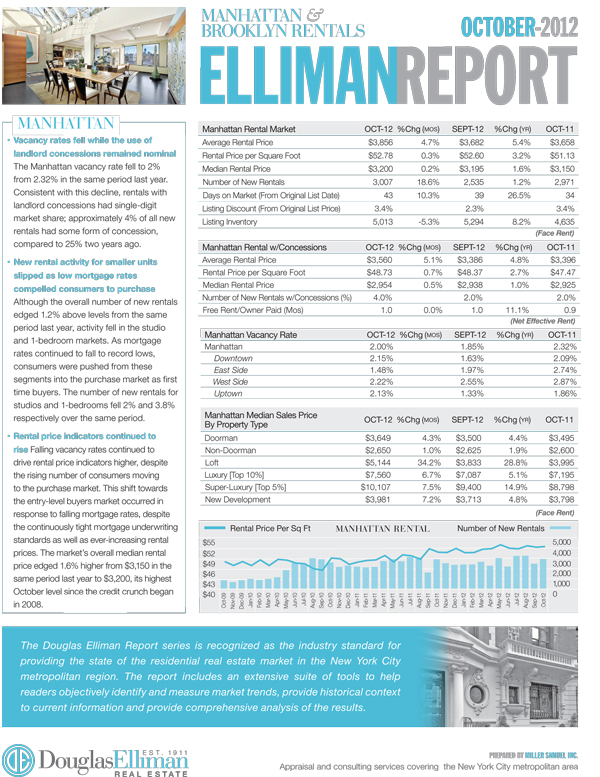
- Falling vacancy rates continue to drive rental price indicators higher despite more consumers moving to the purchase market in response to record low mortgage rates.
- Rents up year-over-year: median +1.6%, rent psf +3.2%, average +5.4%.
- 4% of listings had a landlord concession, averaging 1 month free rent, compared to 25% of listings 2 years ago.
- Vacancy rate fell to 2% from 2.32% year-over-year. East Side had largest decline.
- Overall new rental activity increased 1.2% but slipped for studio/1-bedrooms as falling mortgage rates pulled consumers into purchase market.
- Luxury and Super-Luxury median rents up 5.1% and 14.9% year-over-year.
- Doorman prices continue to rise, outpacing non-doorman price gains.
BROOKLYN
[North, Northwest Regions]
- Tight credit conditions continue to keep rents at elevated levels.
- Rental prices were mixed, but rental price per square foot was $34.72, the highest level for October in more than four years.
- New rentals surged 23.2% over last year?s levels as landlords continue to press rents higher causing more ?churn.?
- Luxury market rent per square foot increase of 10.9% more than doubled the 5.2% gain of the overall market.
- 2-Bedrooms showed largest median sales price gain at 12.8% YOY.
Here?s an excerpt from the report:
MANHATTAN ?The Manhattan vacancy rate fell to 2% from 2.32% in the same period last year. Consistent with this decline, rentals with landlord concessions had single-digit market share; approximately 4% of all new rentals had some form of concession, compared to 25% two years ago?BROOKLYN ?There were 23.2% more new rentals in October than there were a year ago, as high rent levels caused more ?churn? in the marketplace. The jump in listing discount and days on market also reflected landlords tending to push for rent increases at the time of lease renewals?.
You can build your own custom data tables on the Manhattan rental market using quarterly data ? our new monthly format will be available online shortly and we will be phasing in monthly charts to our rental chart gallery soon.
The Elliman Report: 10-2012 Manhattan Rentals [Miller Samuel]
The Elliman Report: 10-2012 Manhattan Rentals [Prudential Douglas Elliman]
Source: http://www.millersamuel.com/blog/elevated-10-2012-manhattanbrooklyn-rental-report/27190
Alan Turing brave Stephanie Rice Meet the Pyro Karen Klein Colorado fires supreme court
No comments:
Post a Comment
Note: Only a member of this blog may post a comment.